
Identify opportunity
Advertisers can learn about their brand, their customers and their competitors, through comprehensive dashboards powered by Cardlytics’ purchase intelligence.


Real insights from real bank customers
Discover how Cardlytics Purchase Intelligence empowers marketers with actionable insights from over 215 million bank customers. By analyzing real, anonymized transaction data, our self-serve dashboards reveal where, when, and how people spend—giving you a competitive edge to better understand your customers, your brand, and your market. From customer loyalty trends to geographic spend patterns and competitor performance, Cardlytics turns data into results-driven strategy.
Our Purchase Intelligence is built on customer transaction data

Where they buy
- The merchant
- The industry & category
- The channel they buy from
- The store’s location

When they buy
- The exact time and day
- How recently
- How frequently
- The season

How much they spend
- The transaction amount
- The merchant’s share
- Customer spending patterns
- Customer loyalty
The Cardlytics Insights Portal: Data-Driven Understanding
Deeply understand your brand, your customers and your competition through the Cardlytics Insights Portal - a self-serve portal with comprehensive dashboards powered by Cardlytics purchase intelligence.
.webp)
Market Summary
Explore brand and category growth across purchase channels
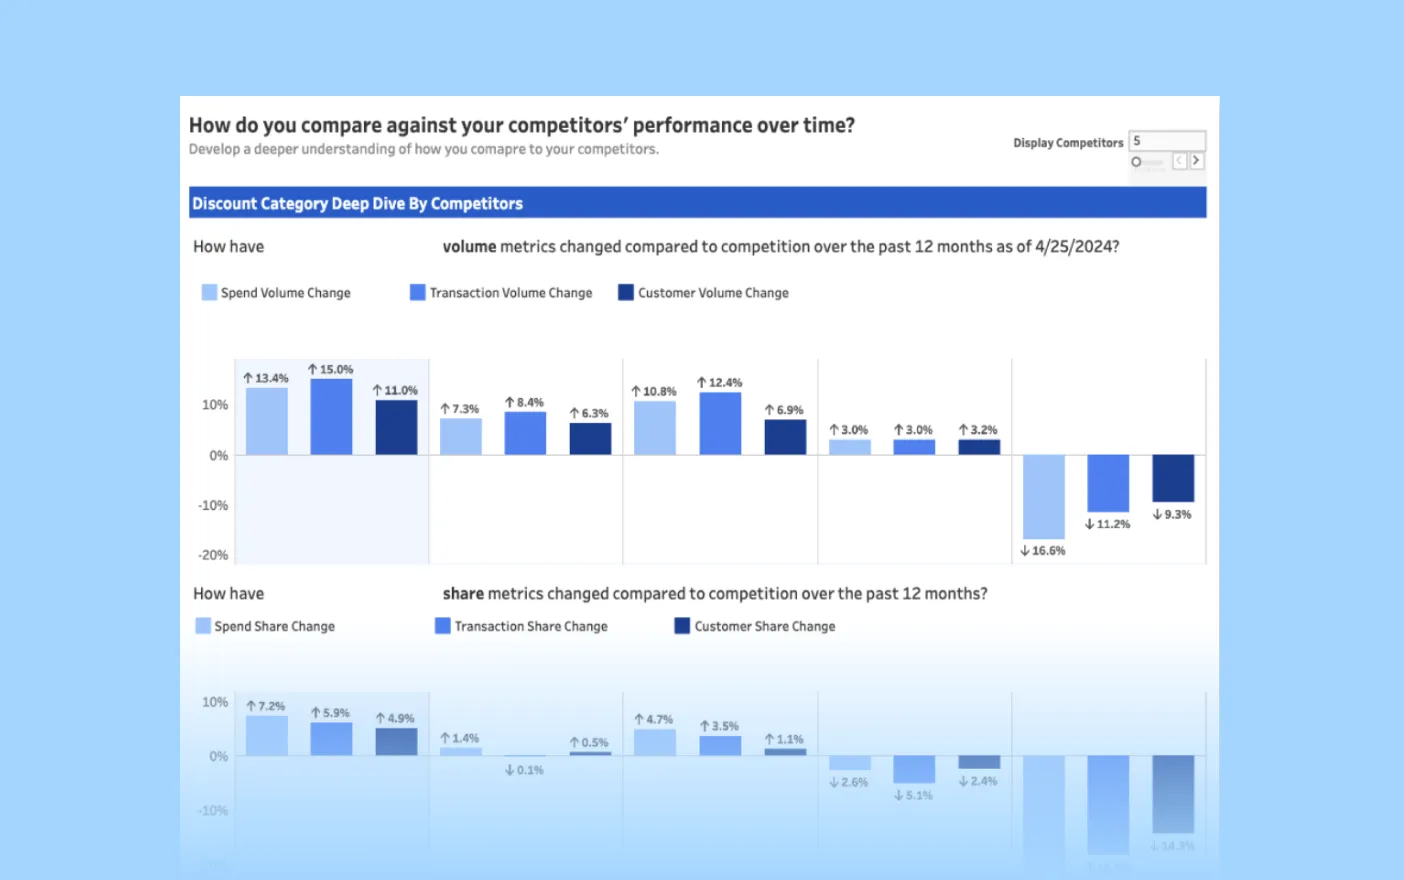
Competitor Insights
See growth and volume trends from named competitors across industries
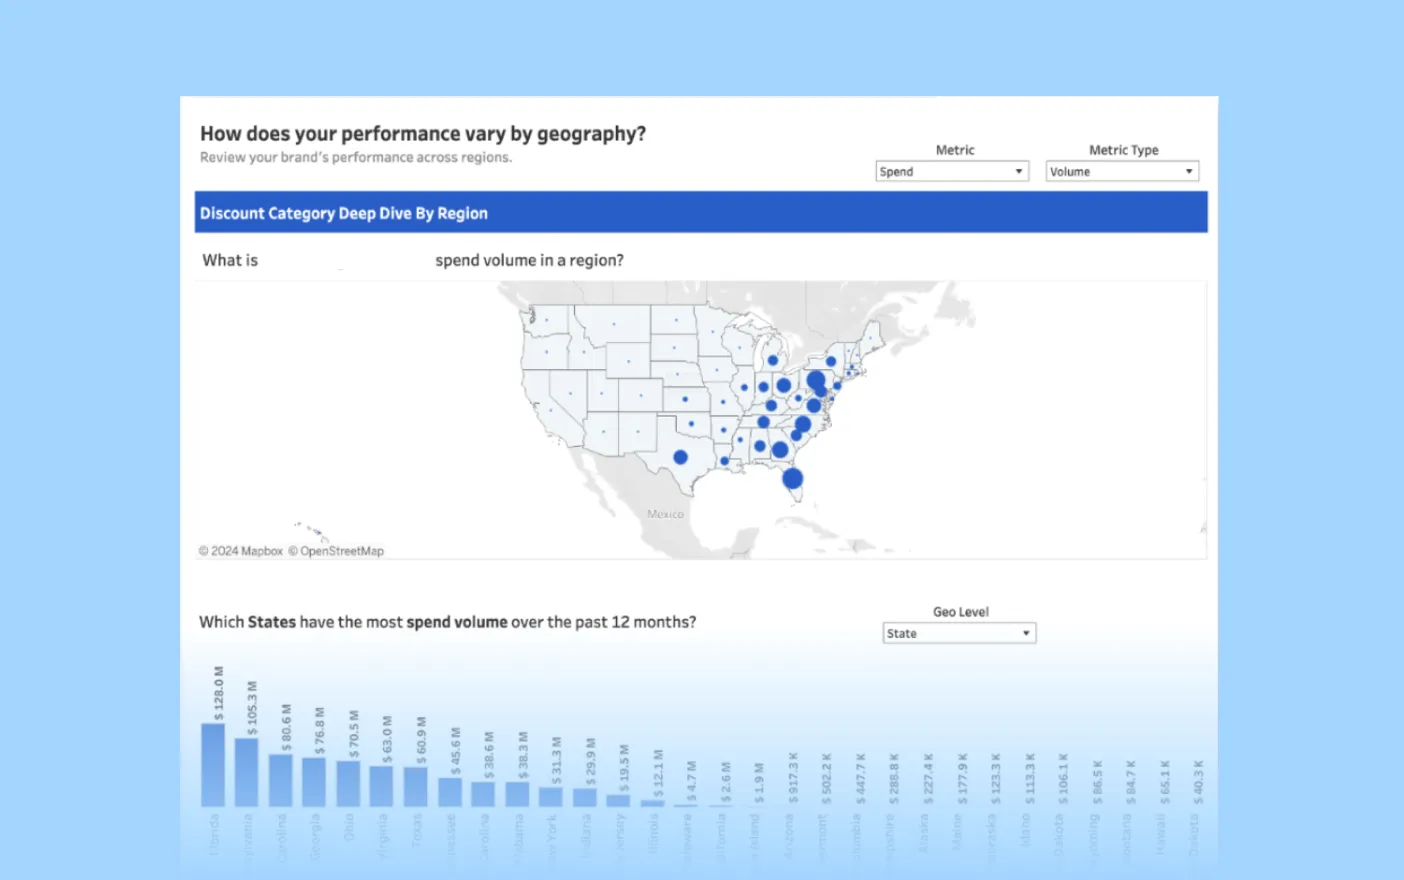
Geographic Insights
View regional spend and competitive comparisons on a state or DMA level
.webp)
Brand Affinity
Identify partnership opportunities with customer brand affinity data to elevate your brand's reach and impact
.webp)
Customer Migration
A dynamic understanding of your customer’s flow to enhance acquisition and minimize churn
.webp)
Loyalty Insights
Maximize customer retention strategies with visibility into valuable loyalty segmentation
Link insights to actionable marketing strategies
Cardlytics Purchase Intelligence is the foundation of all our campaigns. Powered by deterministic purchase data, our card-linked solutions engage targetable audiences to drive online and in-store purchases while measuring performance down to the penny.


“Because of the strong ROI and precise targeting, Cardlytics stands out from other programs that we’ve used in the past. They ultimately deliver more value than other partners.”
Daniel Lane
Director of Retail Marketing, Clarks

REACH REAL PEOPLE
Card-linked offers inspire action by delivering value where it counts
Bot's don't have bank accounts. Our brand-safe, fraud-free platform connects real shoppers with meaningful offers, providing value at the perfect moment and turning intent into action.
72% of consumers prefer brands offering card-linked rewards.
68% are influenced by higher rewards on featured products or categories.
60% see increased value in card-linked offers during financial uncertainty.
MEASURE RESULTS
See the true impact of your campaigns
Cardlytics combines first-party transaction data with powerful analytics to help you measure the incremental impact of your campaigns. See the full picture with omni-channel reporting that ties online and in-store performance directly to ROI or ROAS.
Proven with a rigorous test vs. control methodology, our results deliver measurable incremental sales. Independent verification from Nielsen Sales Lift Measurement and seamless integration with Media Mix Models (MMM) ensure you can trust and act on the insights.

Research & Insights
View all


UK tracked card spend fell 1.2% year-on-year in the first half of 2026, to £71.5bn — the first decline in our four-year series. Read that as a consumer in retreat, and you’ll misread the entire year. This is not a story of retrenchment. It’s a story of redirection. Households paid £2.2bn less to energy and broadband providers in H1, re-spent 60p of every £1 saved, and banked the remaining 40p. Strip household bills out of the numbers and spending actually rose 2.4%.
The biggest structural shift in our dataset
Utilities’ share of wallet has fallen from 26.4% in 2023 to 20.5% today — a six-point structural handback in three years, and the biggest shift we’ve measured. Energy suppliers alone returned £1,759m to households in H1 2026; broadband switching handed back a further £475m. Where did the money go? Into e-commerce (+£382m), specialty grocery (+£186m), discounter grocers (+£132m), taxis (+£124m), apparel (+£106m) and airlines (+£94m). The result is a changing of the guard: Retail is now the UK’s biggest tracked category at 29.3% of wallet, edging past Grocery’s 28.3%.
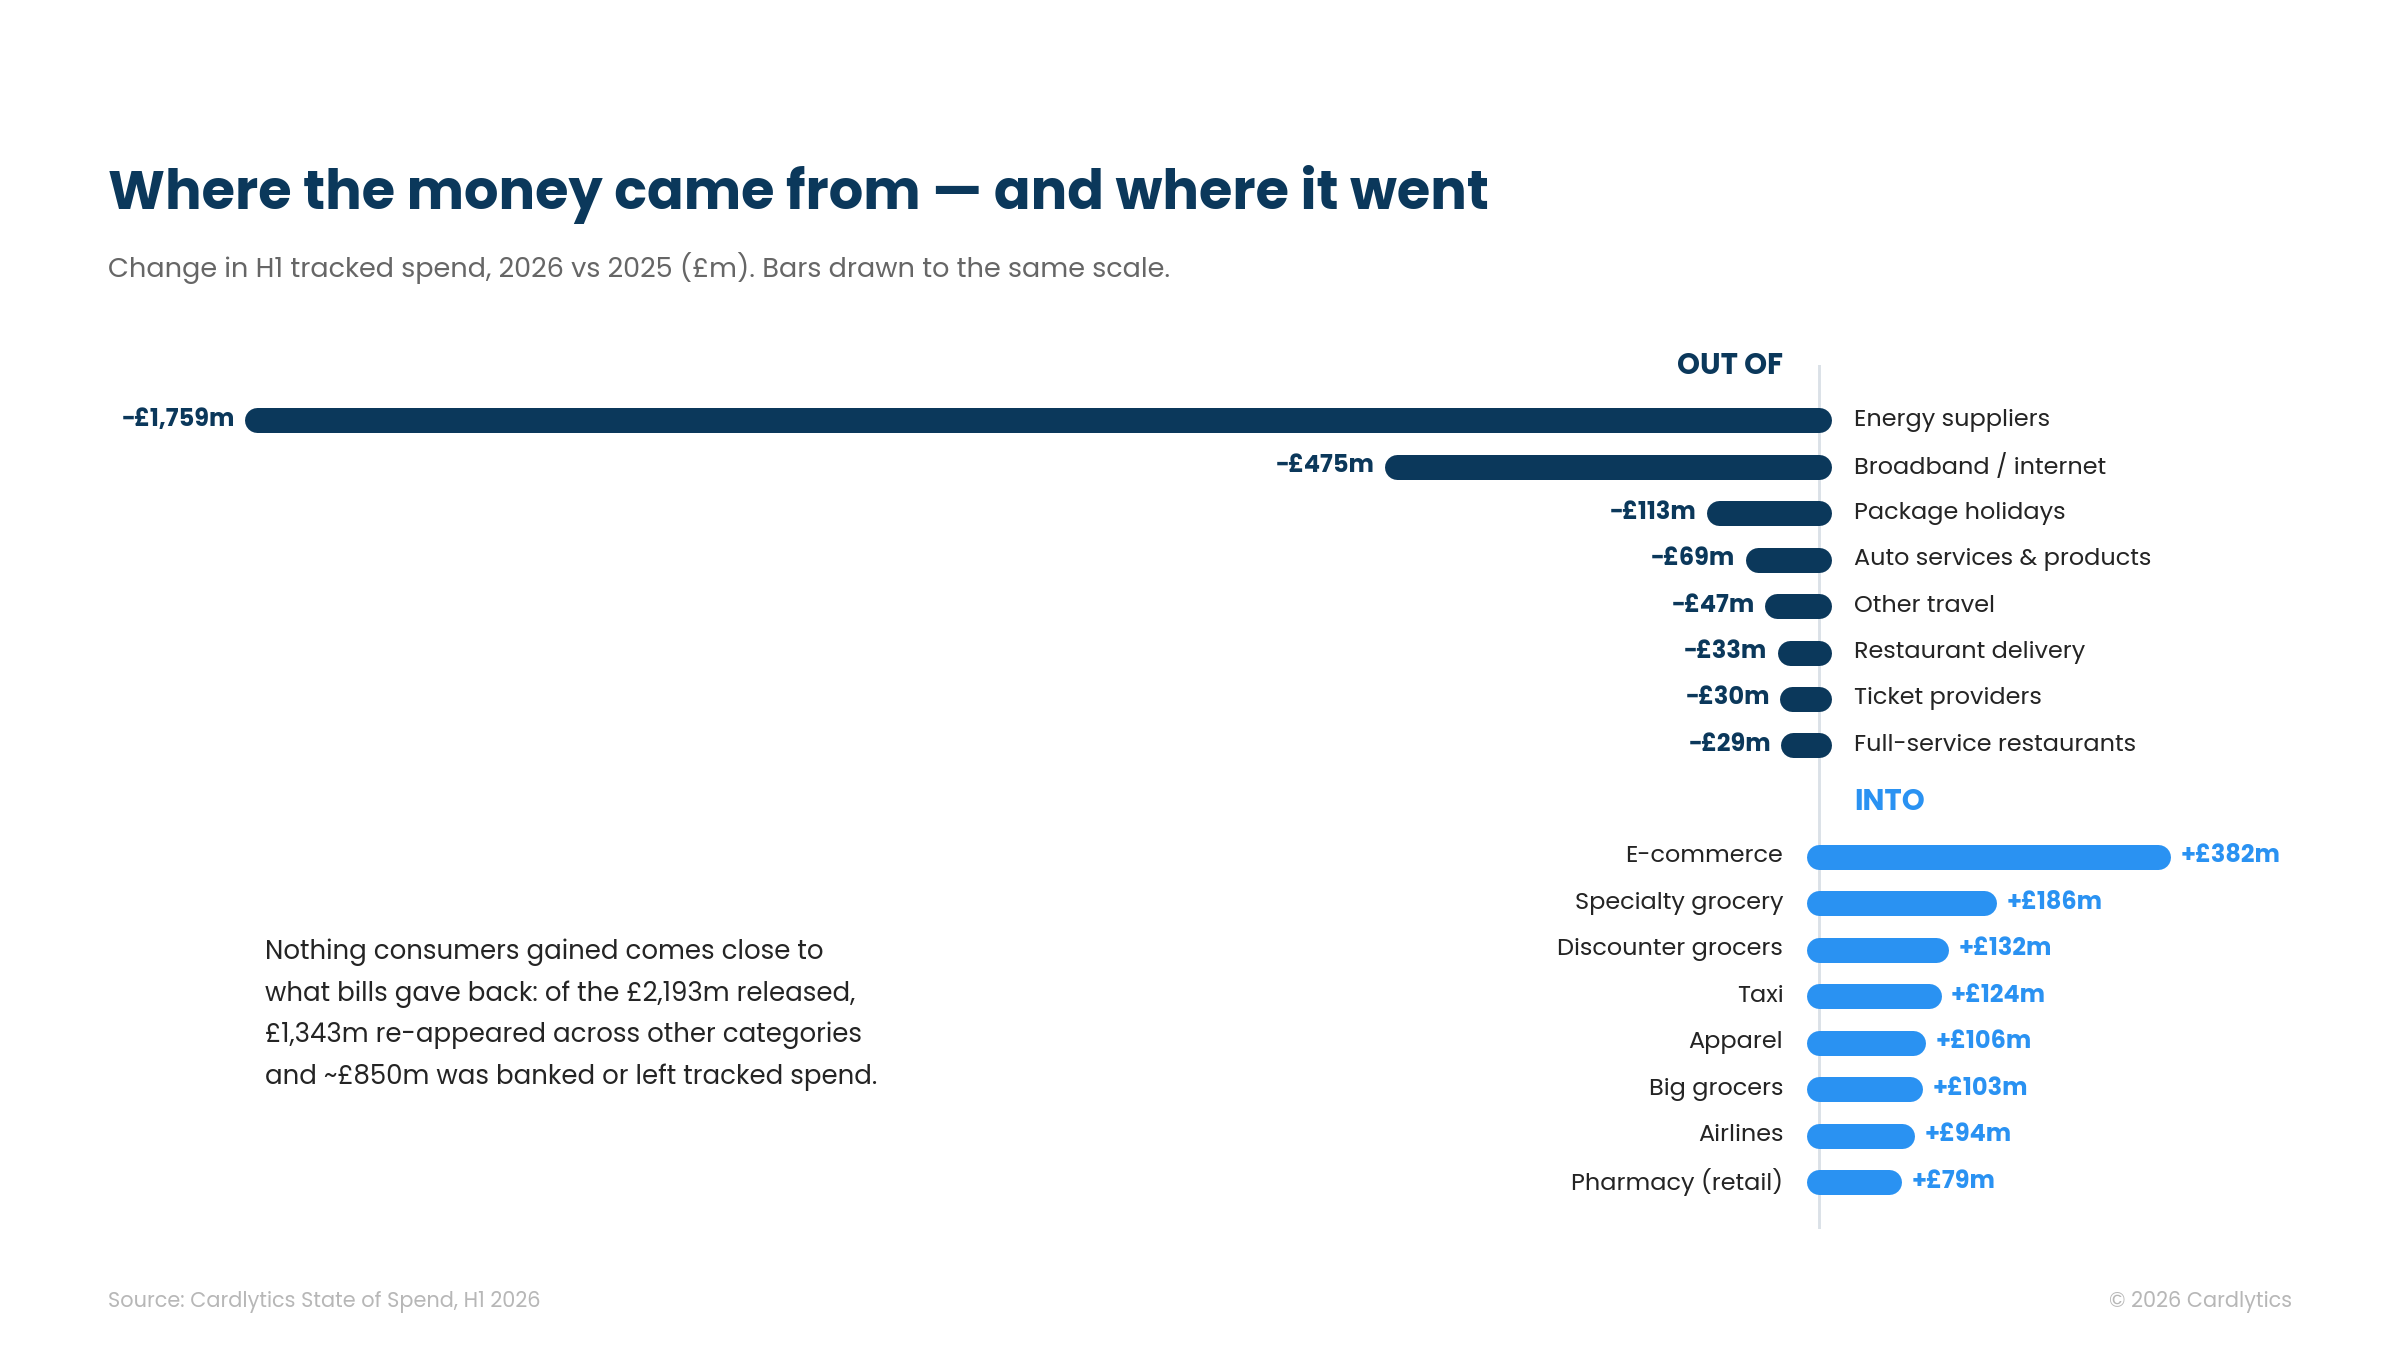
Not every pound found a new home. Of the £2,193m released by bills, £1,343m reappeared across other categories — and roughly £850m left tracked spend altogether, saved or spent beyond the panel.
Value and premium both win. The middle pays for it.
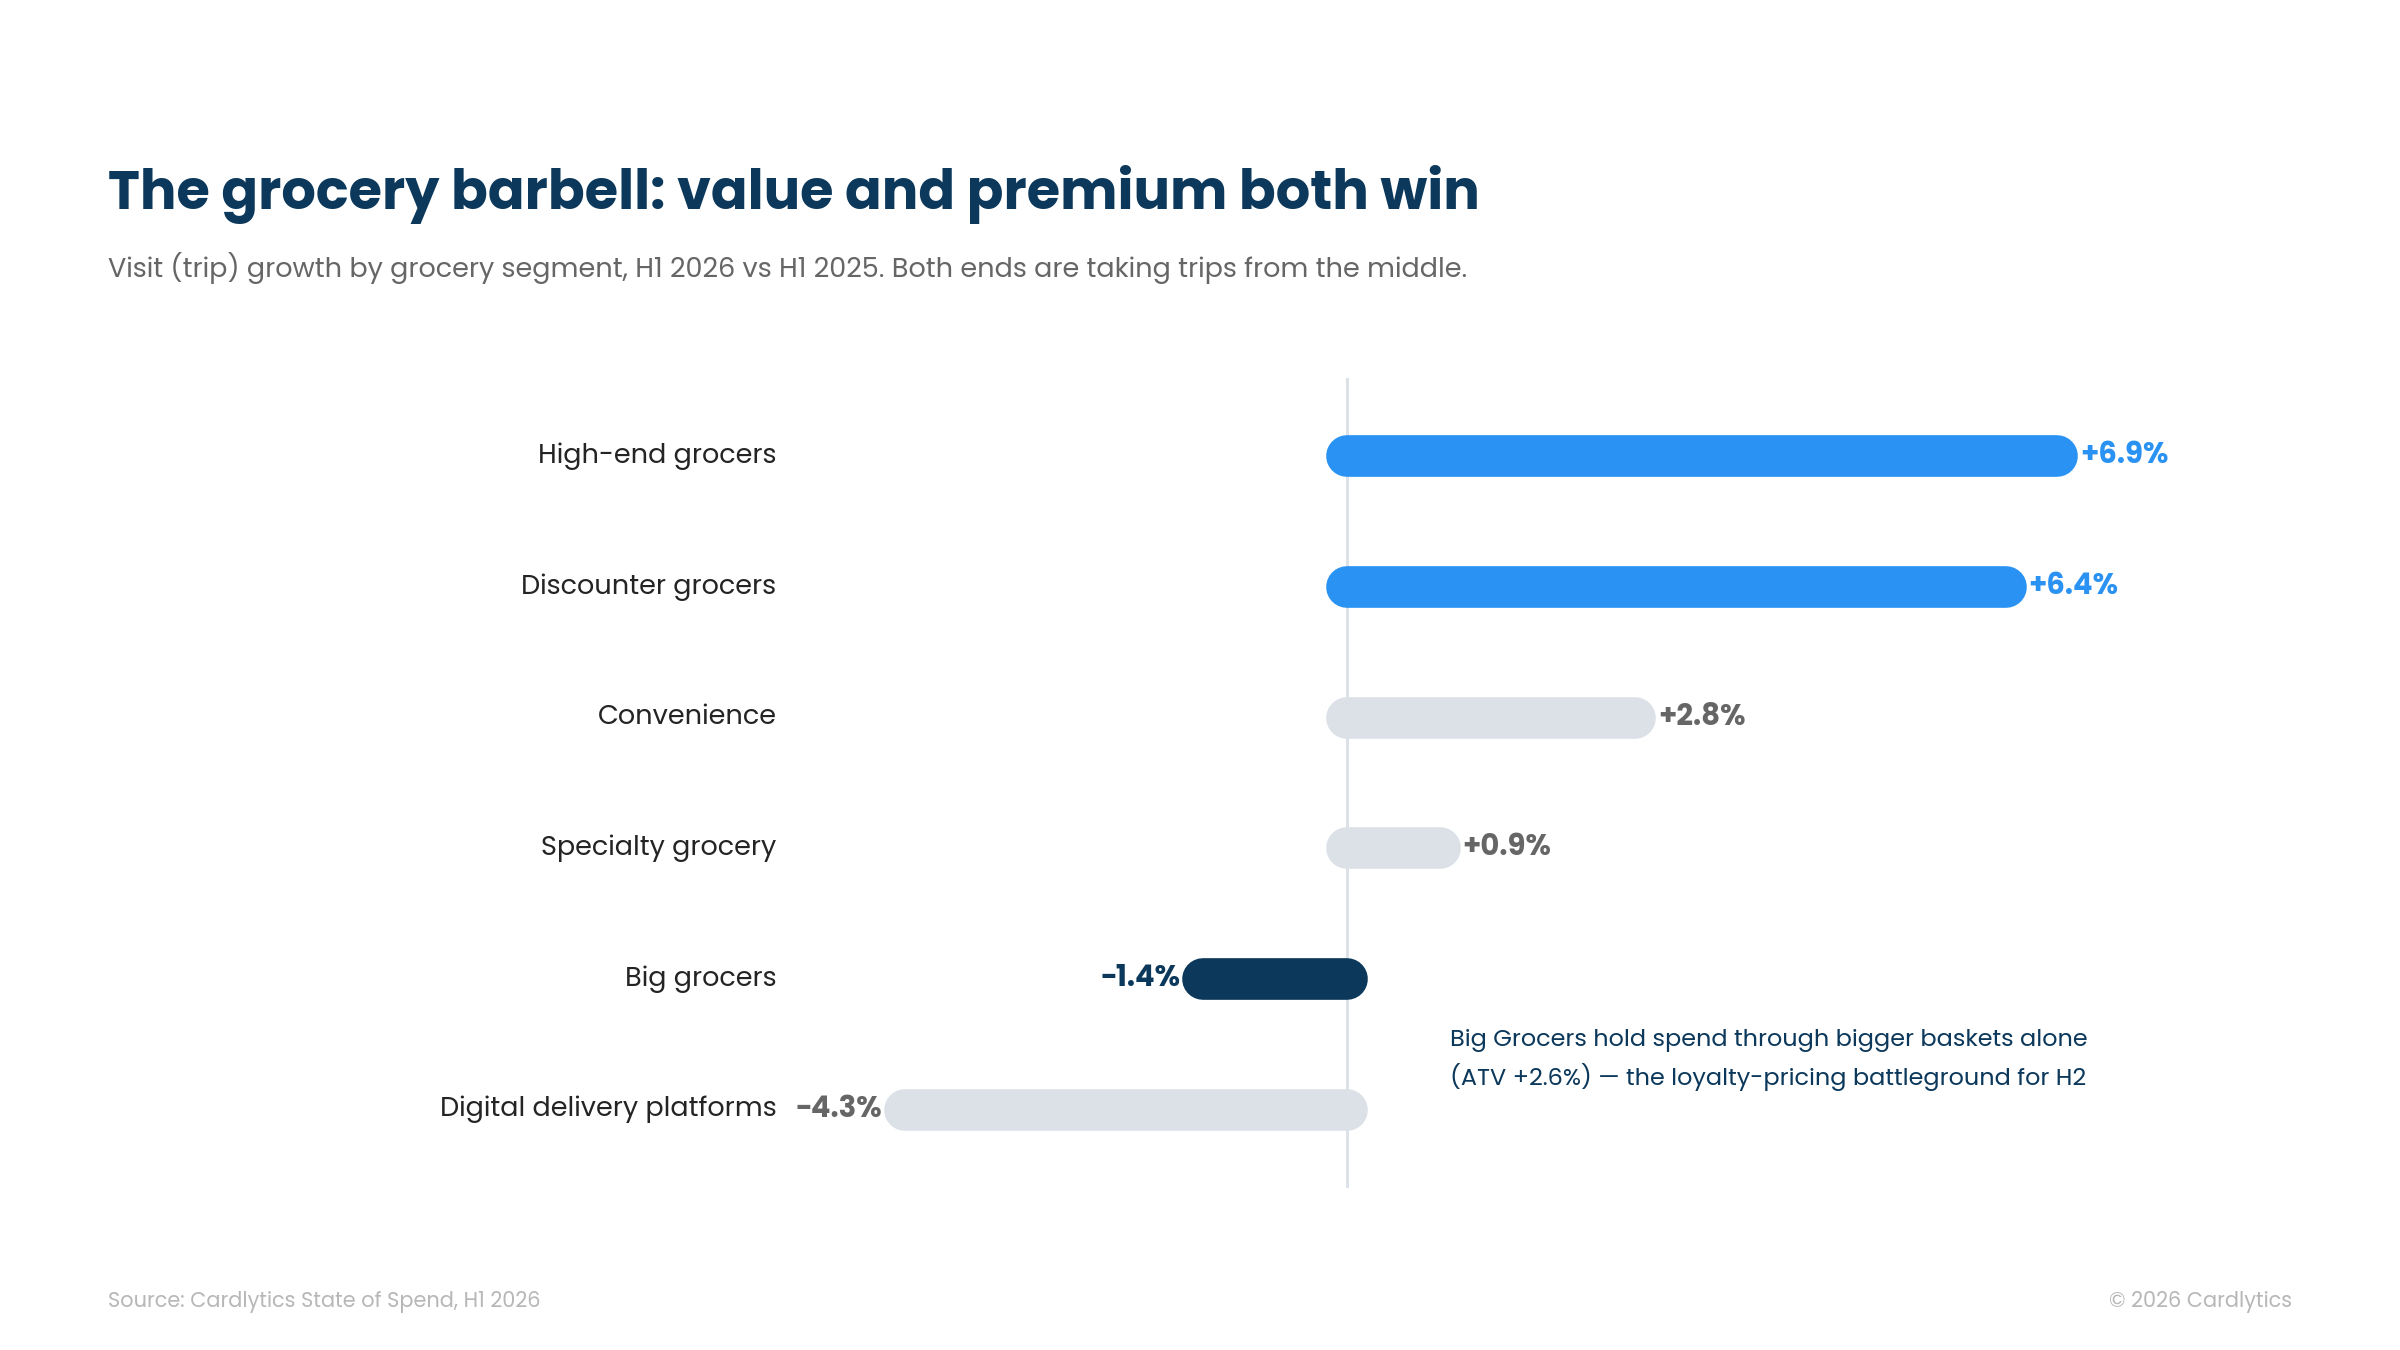
Grocery added £544m (+2.8%), but the growth sits at the two ends of the market. Discounters grew visits 6.4%; high-end grocers grew them 6.9%. Both ends of the barbell are taking trips from the middle: the Big Grocers lost visits (−1.4%) and held spend only through bigger baskets (+2.6% ATV).
And quiet inflation is back. Grocery basket values rose 1.9% — three times the pace of the two prior years — while meal kits sold through grocers grew 23.8% even as DTC meal-kit subscriptions fell 5.5%
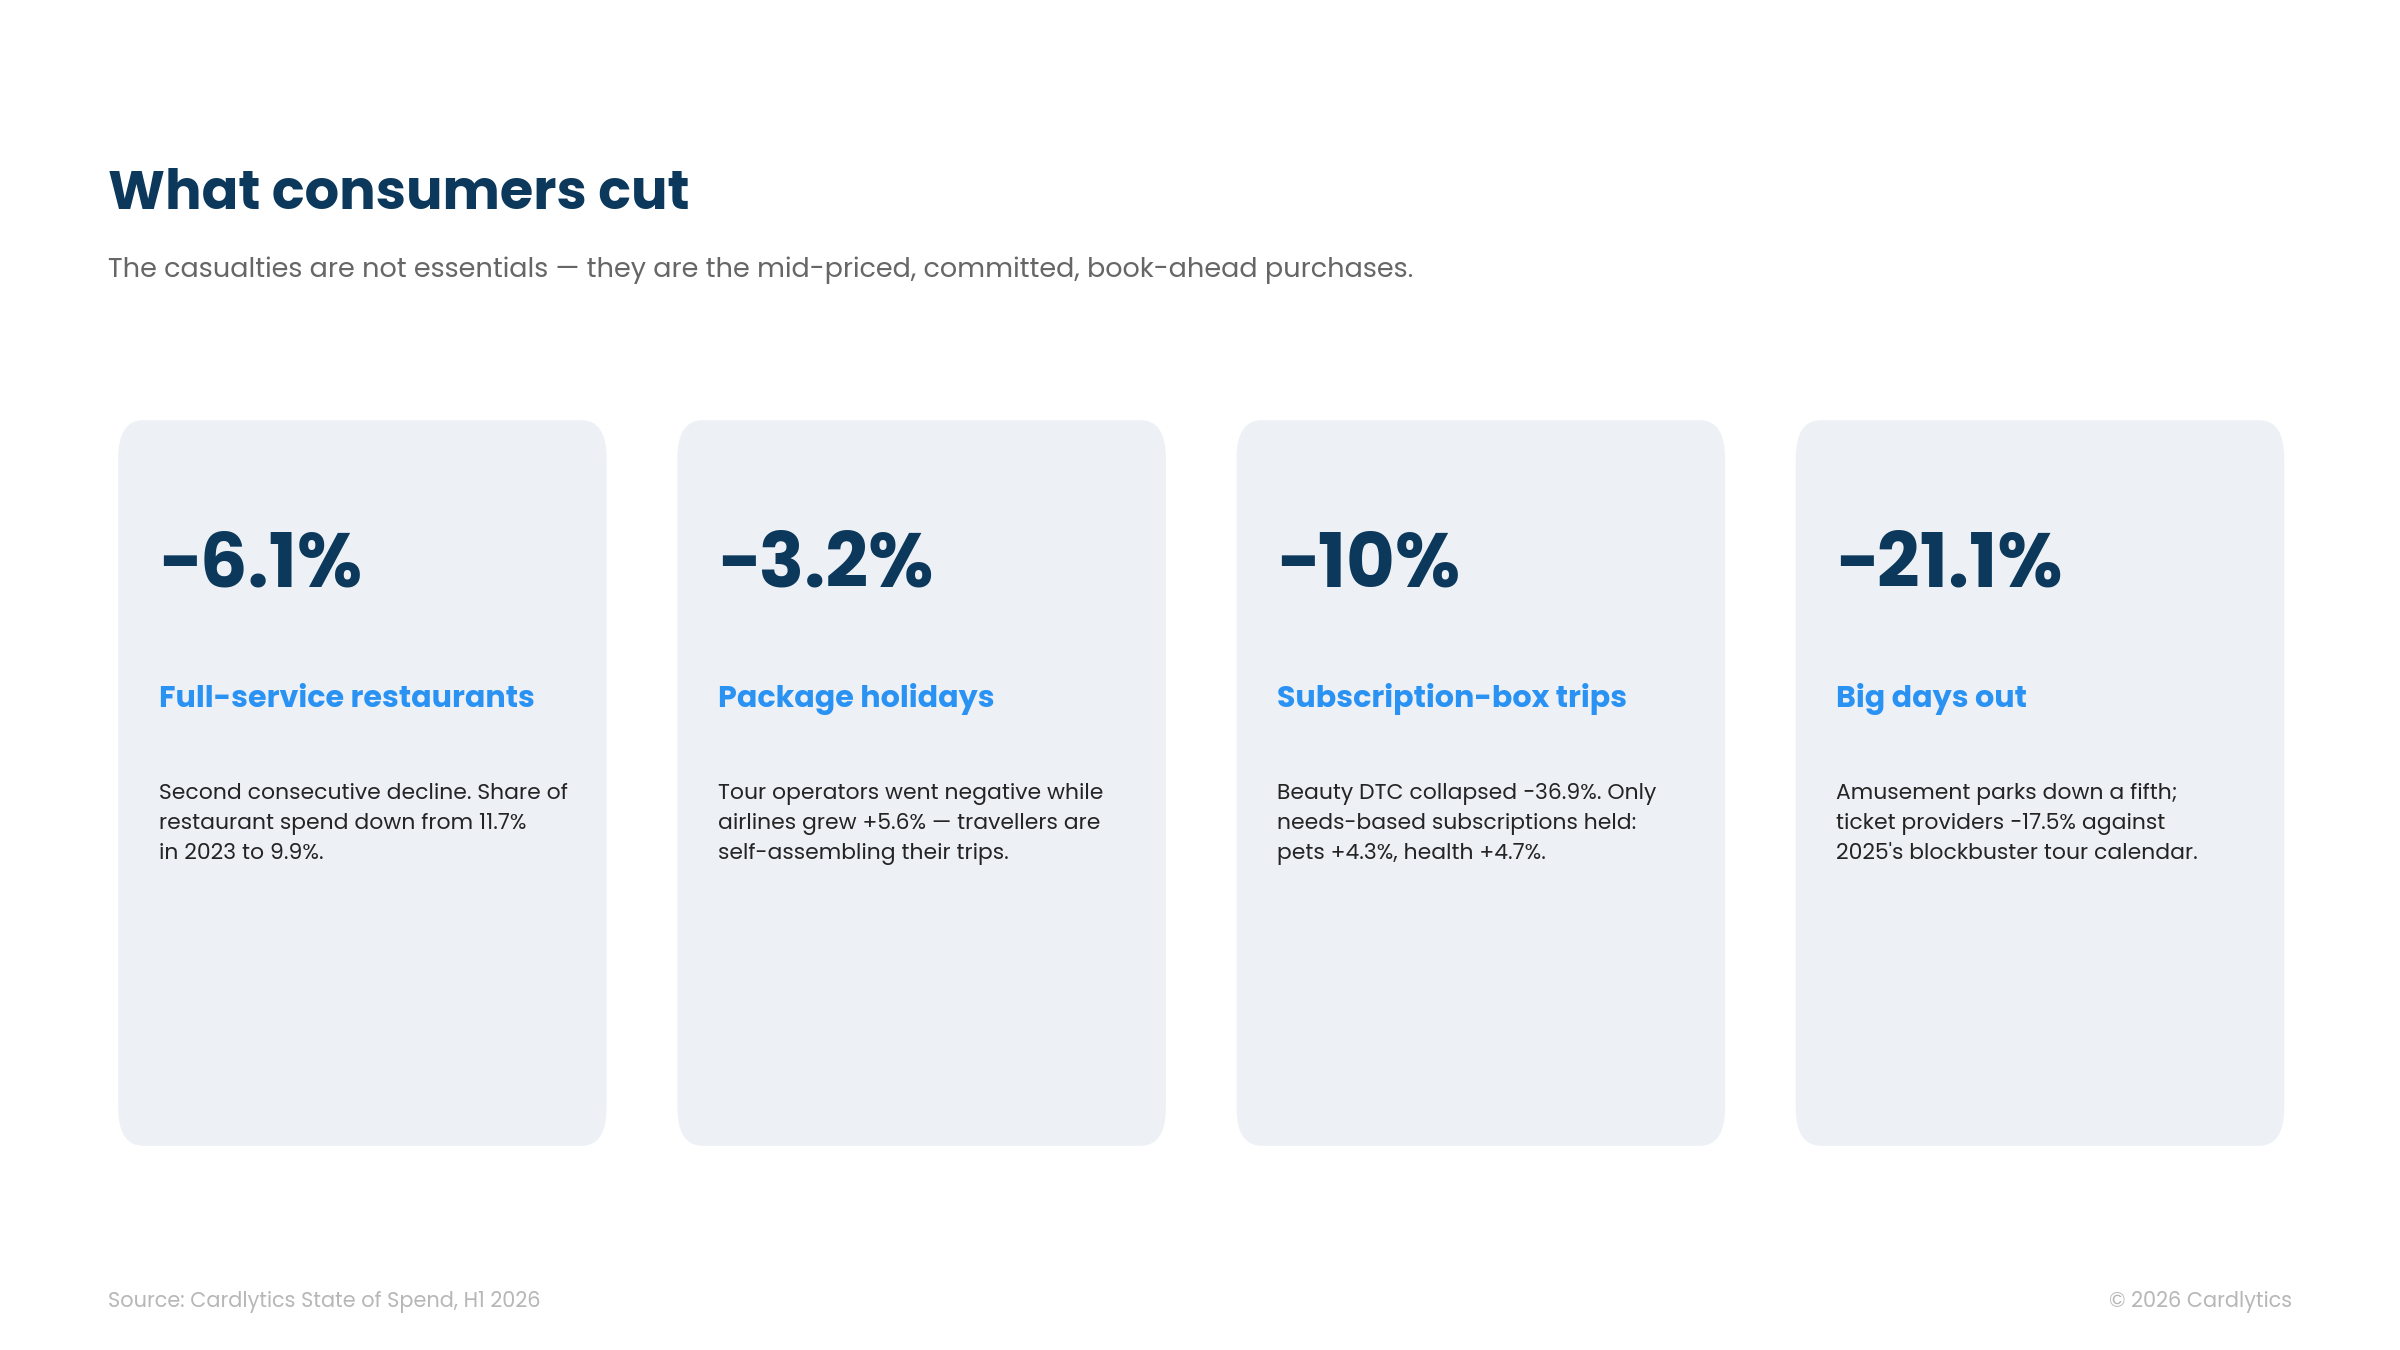
The casualties are mid-priced commitments
What consumers cut isn’t essentials — it’s the mid-priced, committed, book-ahead purchase: the £30 sit-down meal, the package holiday, the monthly box, the big family day out. Full-service restaurants fell 6.1%, a second consecutive decline that takes their share of restaurant spend from 11.7% in 2023 to 9.9%. Package holidays dropped 3.2% while airlines grew 5.6% — travellers are self-assembling their trips. Subscription-box trips fell 10%, with beauty DTC collapsing 36.9%; only needs-based subscriptions like pets (+4.3%) and health (+4.7%) held. And big days out fell hardest, with amusement parks down 21.1%.
Even the apparent winner looks fragile. Fast food grew 5.3% — but every point of it is price. Trips fell 4.2% while transaction values rose 9.9%. Growth built on charging fewer visitors more is a churn risk, not a success story. Expect an H2 value war.
What H2 looks like
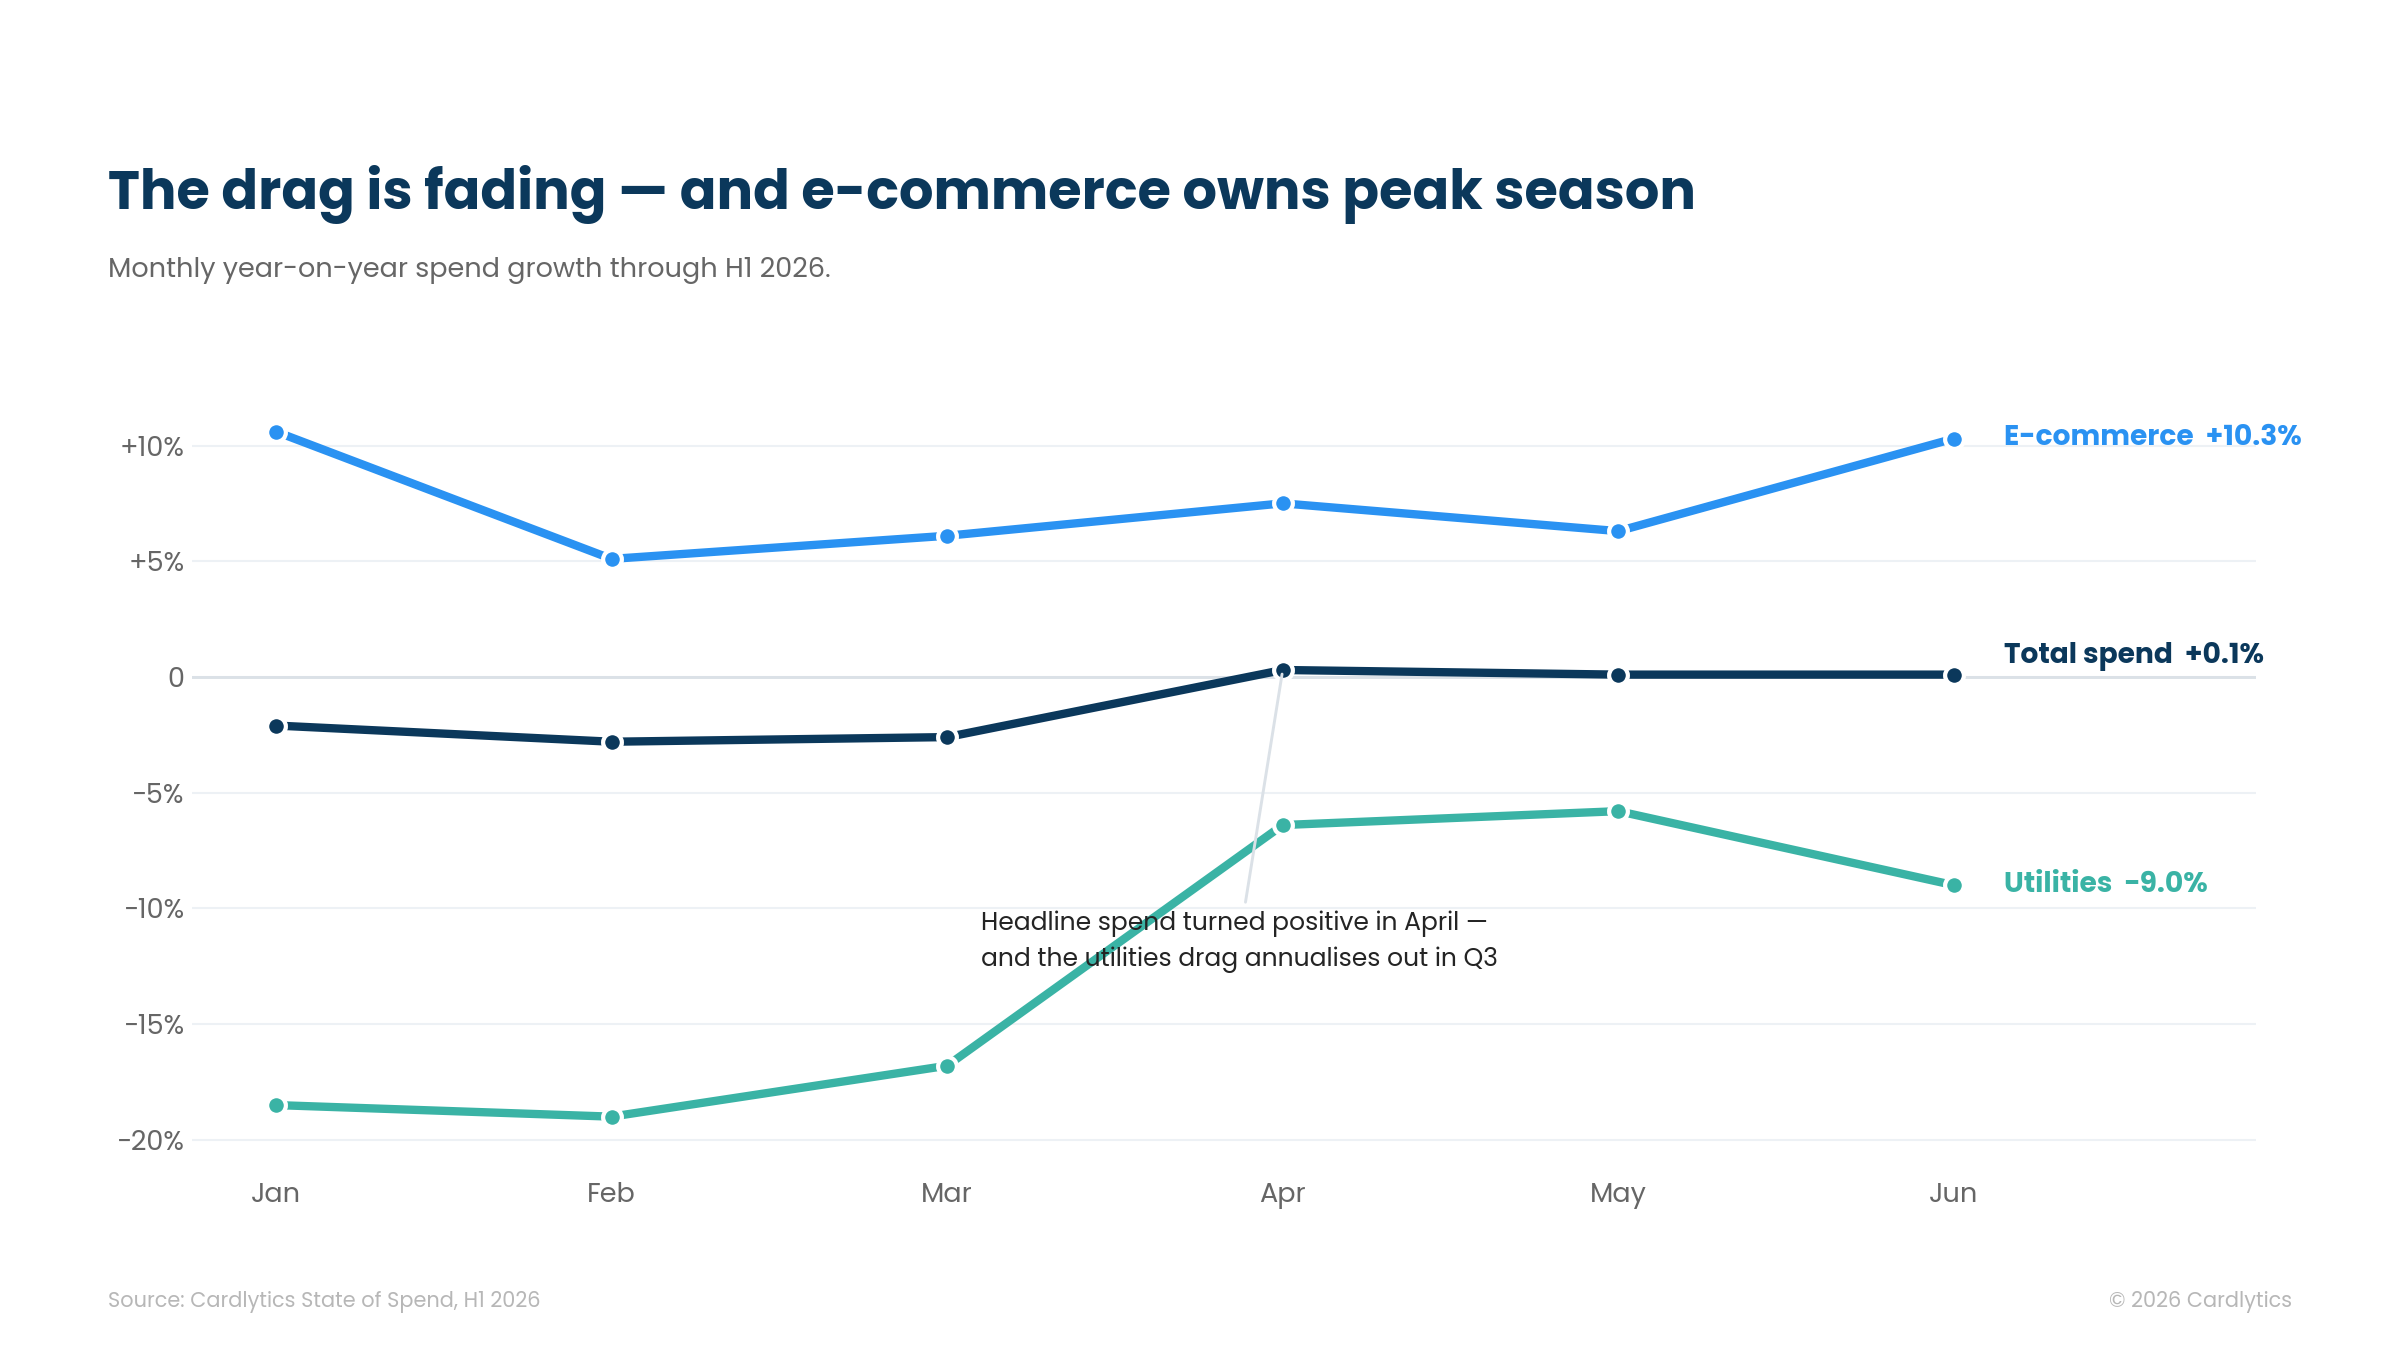
The monthly data points one way. Headline spend turns positive in Q3 as 2025’s energy price cuts annualise out of the comparison. E-commerce — six straight months of acceleration, +10.3% in June — owns peak season from Prime Day through Black Friday to Christmas. Apparel goes negative without intervention, after an eight-point deceleration in six months. The value war spreads from grocery loyalty pricing to QSR discounting. Travel books later and shorter. And pharmacy keeps compounding, growing 65–75% in every month of H1 — on track to roughly double 2024 levels by year-end.
What advertisers should do while the money is in motion
Each shift needs a different brief — and this is precisely where Card-Linked Offers and Cardlytics Insights earn their keep.
Grocers should fight on trips, not baskets: with spend held up by inflation alone, offers must defend visit frequency against both discounters and premium switchers. Retailers should start peak season early — e-commerce momentum says pull Q4 acquisition forward, and apparel brands need conquesting and basket-building before the decline hardens. Restaurants should buy back the lost visit with frequency-based offers that attack the trips problem directly. Travel brands should move offers closer to departure and target lapsed package-holiday spenders with DIY trip components — flights, stays, taxis. Subscription brands should put retention before acquisition: with trips down 10%, churn-saving offers are the priority. And everyone should court the wellness wallet — pharmacy is the fastest-growing high-value audience in our panel, relevant to health, beauty, fitness and grocery advertisers alike. The £2.2bn switch is still in motion. The brands that win H2 will be the ones that meet the money where it’s moving — not where it used to live.
About this data
Findings draw on Cardlytics UK card-spend data across a panel of 2,195 tracked brands, mapped to 8 categories and 58 subcategories. The analysis covers January–June of 2023–2026 on spend, trips and average transaction value (ATV). Year-on-year comparisons are H1 2026 vs H1 2025 unless stated.

What UK travellers did in the first five months of 2026 — and what the data predicts for the rest of the year.
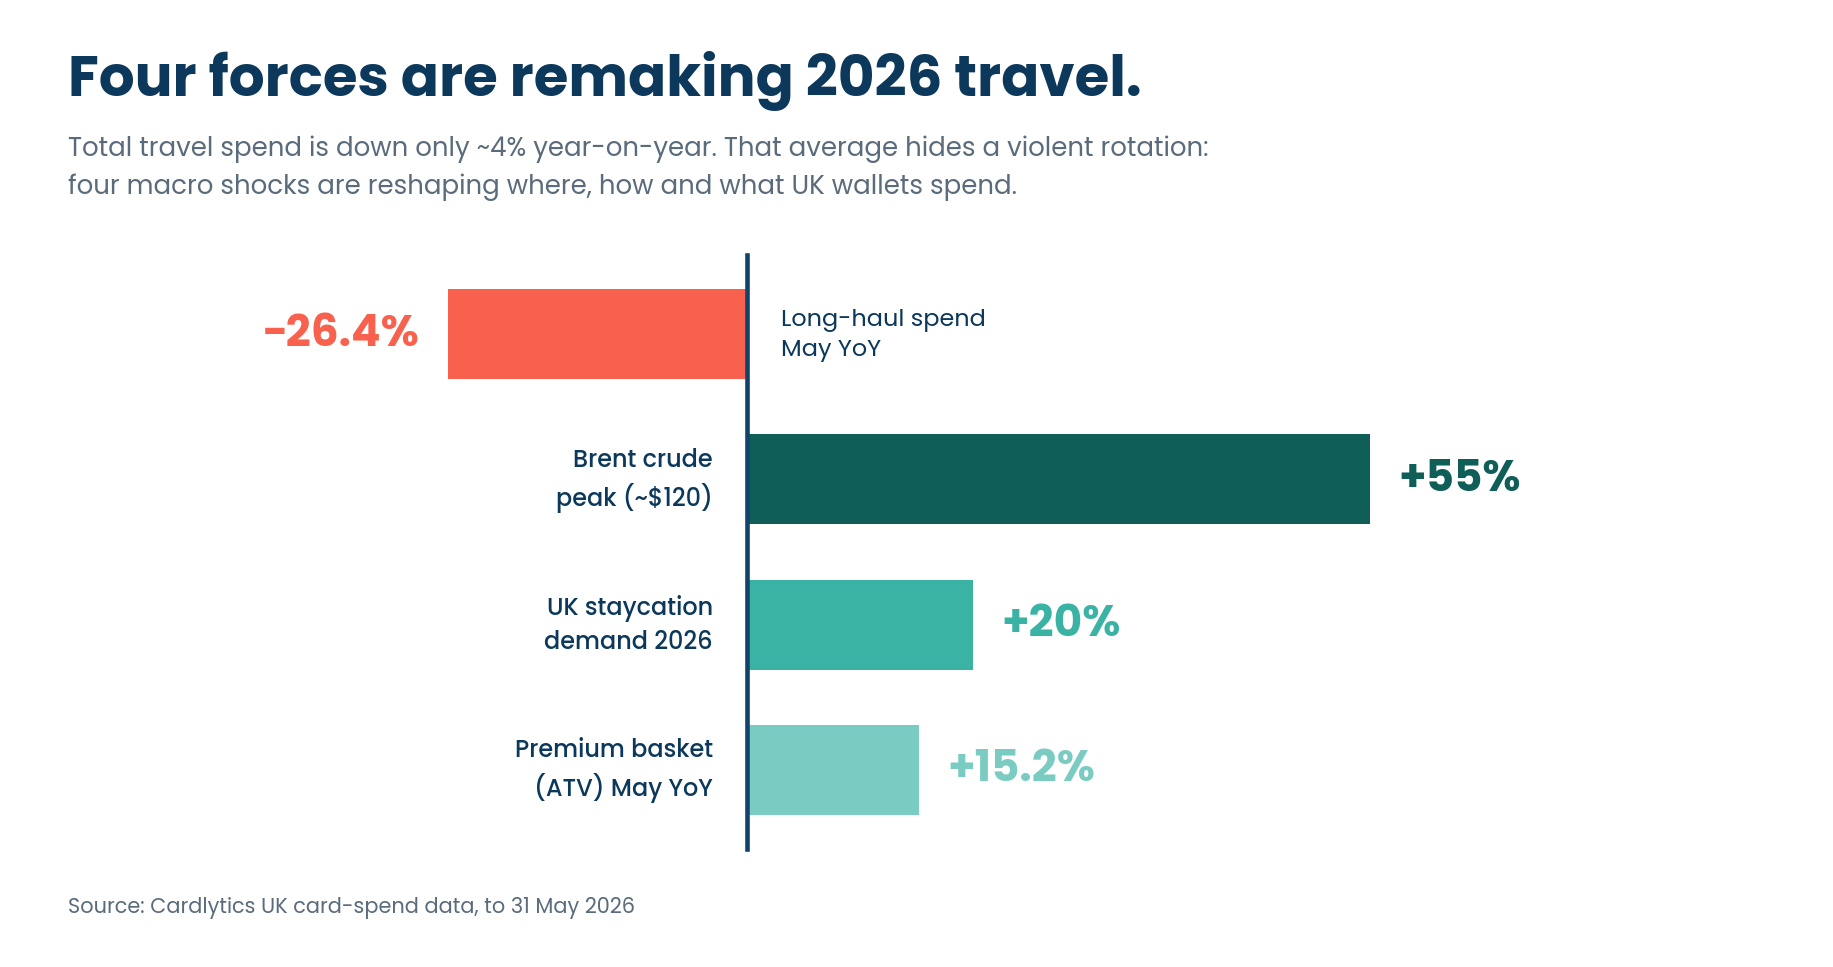
UK travel spend looks steady on the surface — down just ~4% year-on-year. Look closer, and the story isn't decline. It's rotation.
New analysis from Cardlytics, drawing on UK card-spend data to the end of May 2026, shows four macro shocks — the US–Iran conflict, a jet-fuel supply squeeze, a staycation surge, and a resilient premium wallet — quietly redrawing where, how and what UK travellers book.
Four shifts travel leaders shouldn't ignore
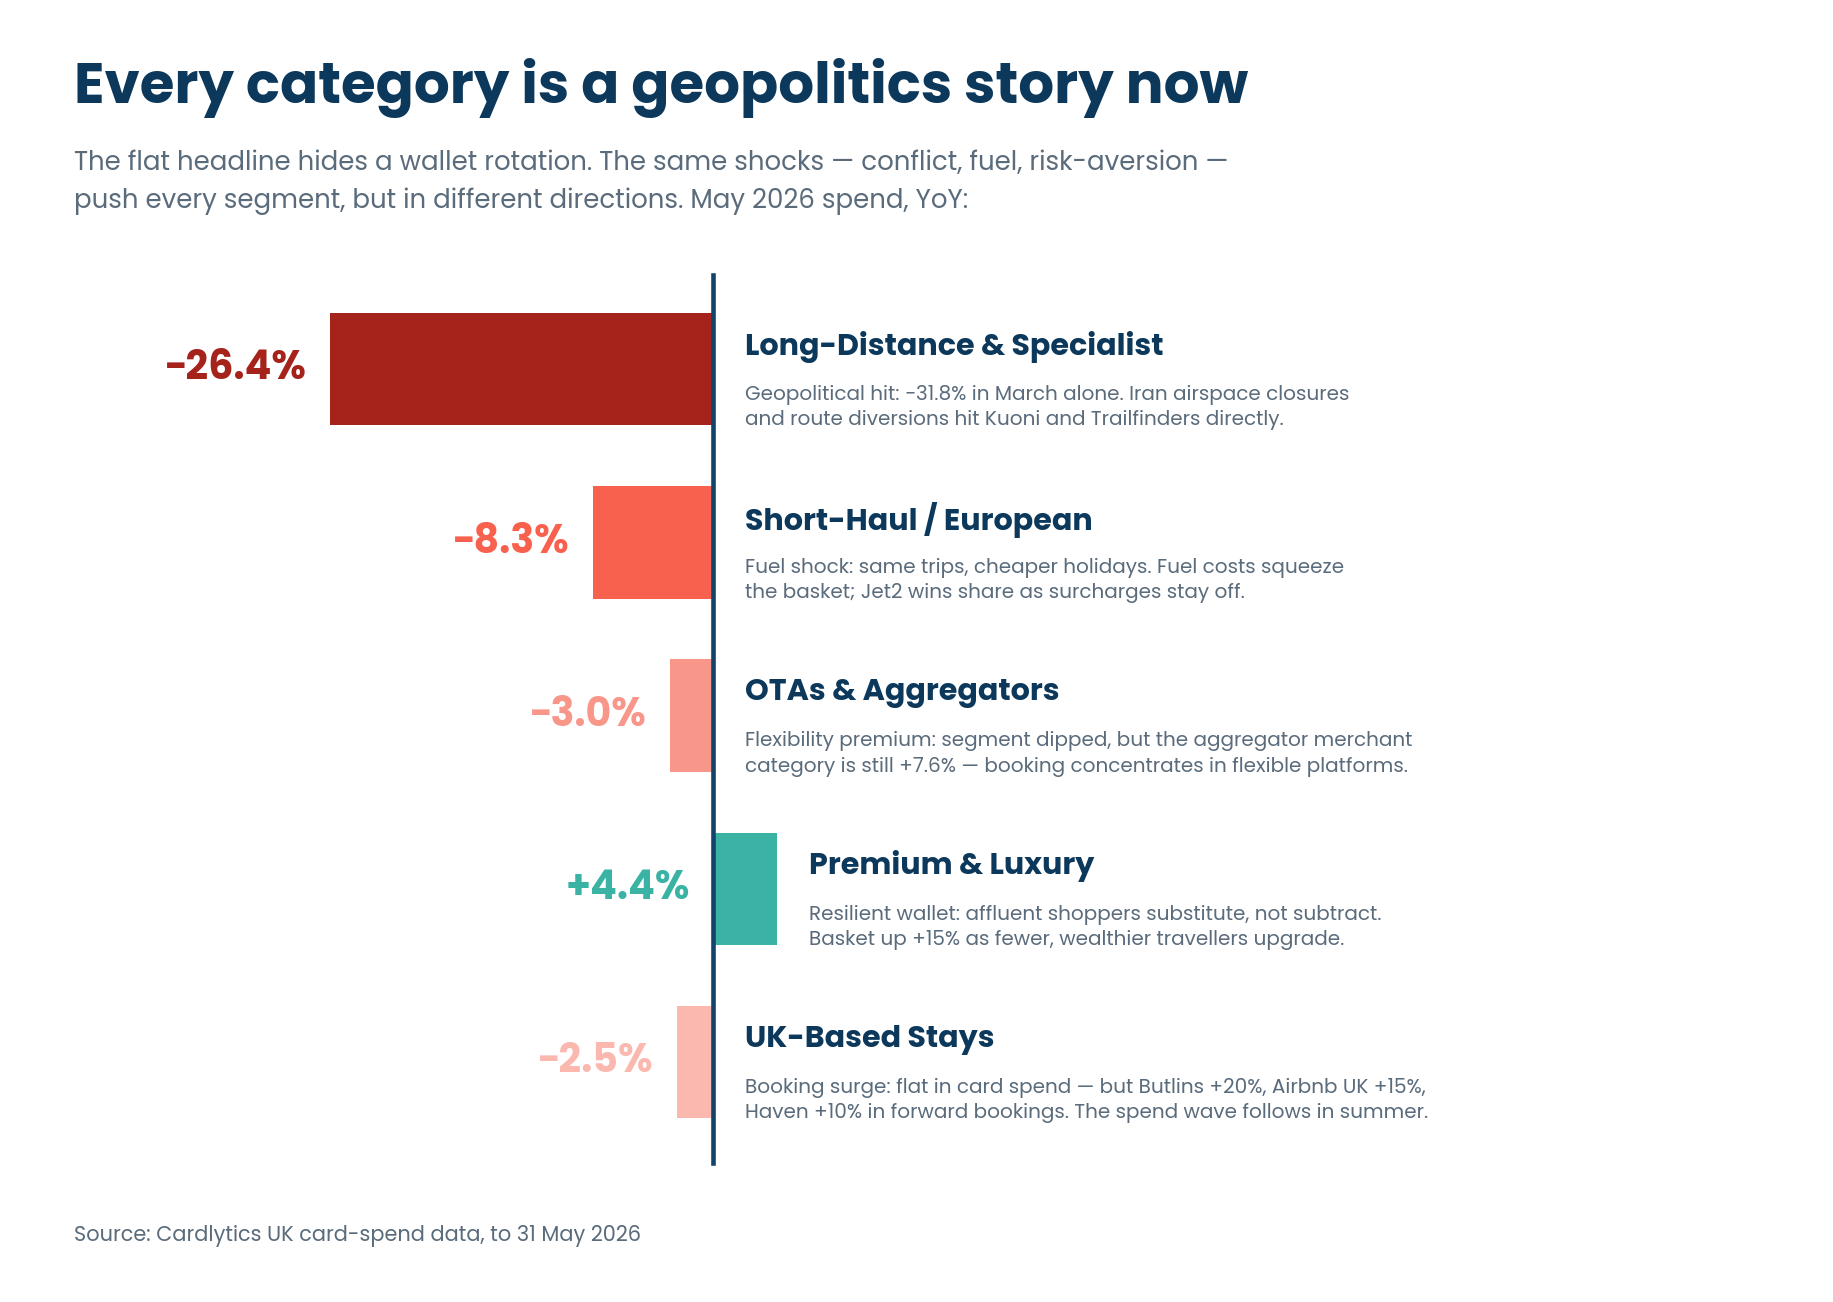
Long-haul is falling off a cliff. Long-Distance & Specialist spend fell 26.4% in May year-on-year — but trips fell 29.4%. Nearly a third of journeys are gone, and rising ticket values are masking a real, geopolitically-driven pullback.
Booking is moving to the middlemen. The travel aggregators and agencies category grew 7.6% while tour operators fell 10.1% and cruise lines 9.8%. Facing an uncertain
backdrop, consumers are paying a premium for flexibility — booking through platforms they trust to find value and re-route them.
Premium travellers substitute — they don't subtract. Premium & Luxury spend rose 4.4%, with the average basket up 15.2%. Fewer, wealthier travellers are trading up, and luxury domestic stays are absorbing displaced long-haul demand.
The staycation wave hasn't hit the card data yet. UK domestic demand is up around 20% year-on-year, with 46% of Brits citing global conflict as a reason to holiday at home. Forward bookings are surging — the spend wave lands this summer.
Unlock the full State of Spend: Travel Edition
The headline numbers hide the real story: a collapse in long-haul trips, a flight to flexible booking, and a premium wallet that refuses to slow down. Download the full report for the segment-by-segment breakdown and four travel plays for a cautious wallet.
Inside the report:
- The Long-Haul Cliff: why trips fell nearly 40% in March — and what rising
ticket values are hiding. - Same Shift, Five Behaviours: spend decomposed into trips and basket size, from mass desertion to trading up.
- Where Spend Flows: the merchant categories gaining and losing share as booking concentrates with aggregators
- Four Travel Plays: where Card-Linked Offers and Cardlytics Insights should focus for OTAs, long-haul operators, premium brands and short-haul carriers.


Four signals from a shifting wallet — and what they mean for advertisers.
UK consumer spending looks healthy on the surface. Look closer, and the wallet is quietly diverging.
New analysis from Cardlytics, drawing on UK purchase data across more than 60 million enabled accounts, shows positive year-on-year spend growth across every macro category in H1 2026. But transactions, customer counts, and basket sizes tell a very different story underneath.
Consumers are protecting holidays, paying more for fewer nights out, and trading down on the high street.
Three shifts leaders shouldn't ignore
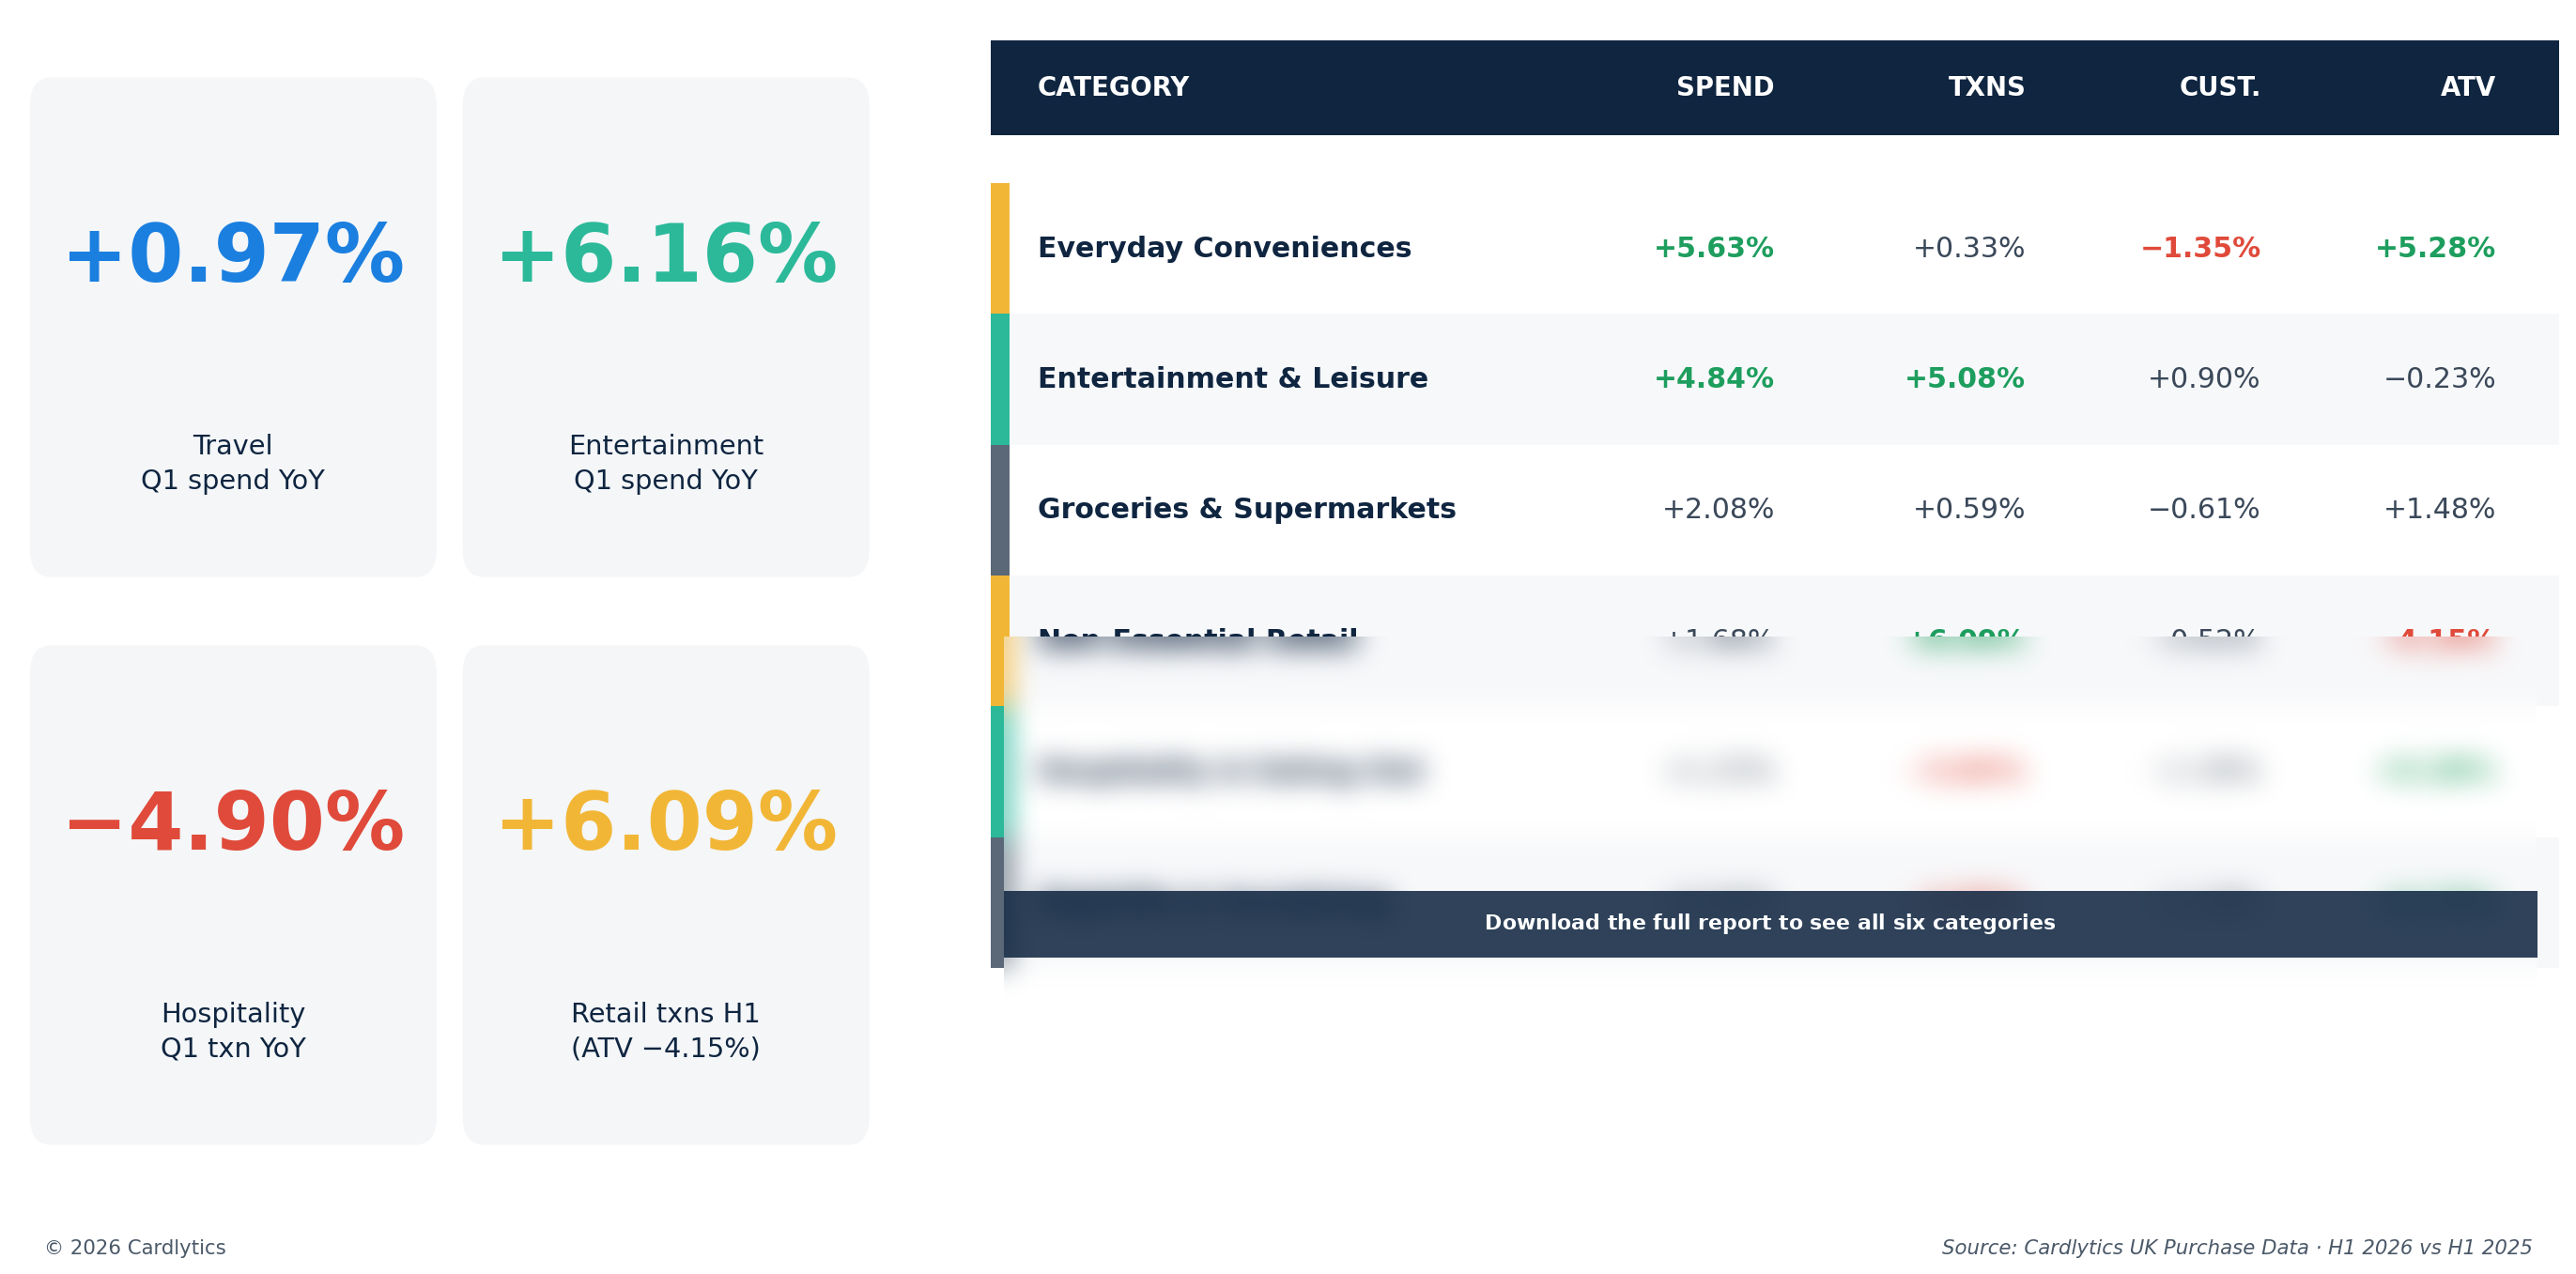
Holidays held, but restaurants didn't. Hospitality lost 3.83% of transactions year-on-year in H1; Nightlife lost 3.95%. Travel grew 0.97% in Q1, with Entertainment & Leisure up 6.16%.
Inflation is doing the heavy lifting on the high street. Hospitality, Nightlife, and Everyday Conveniences all posted positive spend growth — but only because average ticket value rose around 5%. Real visit frequency is falling.
Retail is winning volume and losing value. Non-Essential Retail transactions rose 6.09% in H1 while average basket size fell 4.15%. Consumers are shopping more often and spending less per basket — a clear discount-led signal.
Spend and transactions tell two different stores
Unlock the full Q2 State of Spend report
Top-line growth is masking a structural pullback in mid-week dining, a narrowing active customer base, and a discount-driven retail shift. Download the full report for the category-by-category breakdown and the four advertiser playbooks for an uneven wallet.
Inside the report:
- The "Who Is Losing?" Index: How six macro categories really performed once ATV inflation is stripped out.
- The Hospitality & Nightlife Squeeze: Why footfall is down ~4% even as spend ticks up.
- The Retail Paradox: Record transaction frequency colliding with shrinking baskets.
Four Playbooks for Advertisers: Where to drive frequency, where to grow basket size, and where loyalty beats acquisition in Q3.
Get in touch
Need additional information or have a question? Tell us a little bit more and we’ll respond shortly.